
Solar Costs in 2026: A Realistic View
If you’re thinking about going solar, you probably want a straight answer: what will it actually cost in 2026? Right now, expect to see an average installation price somewhere between $2.50 and $3.50 per watt. This isn’t a dramatic drop from 2024 costs, but it’s a stabilization after the rapid price increases we saw a few years ago. Supply chain issues are easing, and manufacturing capacity is increasing, which is helping to keep prices in check.
I think it's important to manage expectations. The days of huge yearly price drops are likely over, but we are seeing some promising developments in incentive programs, especially at the state level, that can significantly reduce your out-of-pocket costs. Don’t fall for overly optimistic promises; a realistic approach is crucial. For context, in 2020, the average cost hovered around $3.86 per watt, dipped during the height of pandemic-related supply chain disruptions, and has been slowly creeping back up as demand increased.
Several factors will influence these prices. The continued development of more efficient panel technology, the scaling of domestic manufacturing (encouraged by the Inflation Reduction Act), and competition among installers will all play a role. I'm keeping a close watch on the potential for new materials and manufacturing processes to further lower costs, but those are still largely on the horizon.
This article provides a state-by-state breakdown of solar panel installation costs in 2026 and discusses how to calculate your potential return on investment. We examine the components that make up the total cost and the incentives that can help offset it.
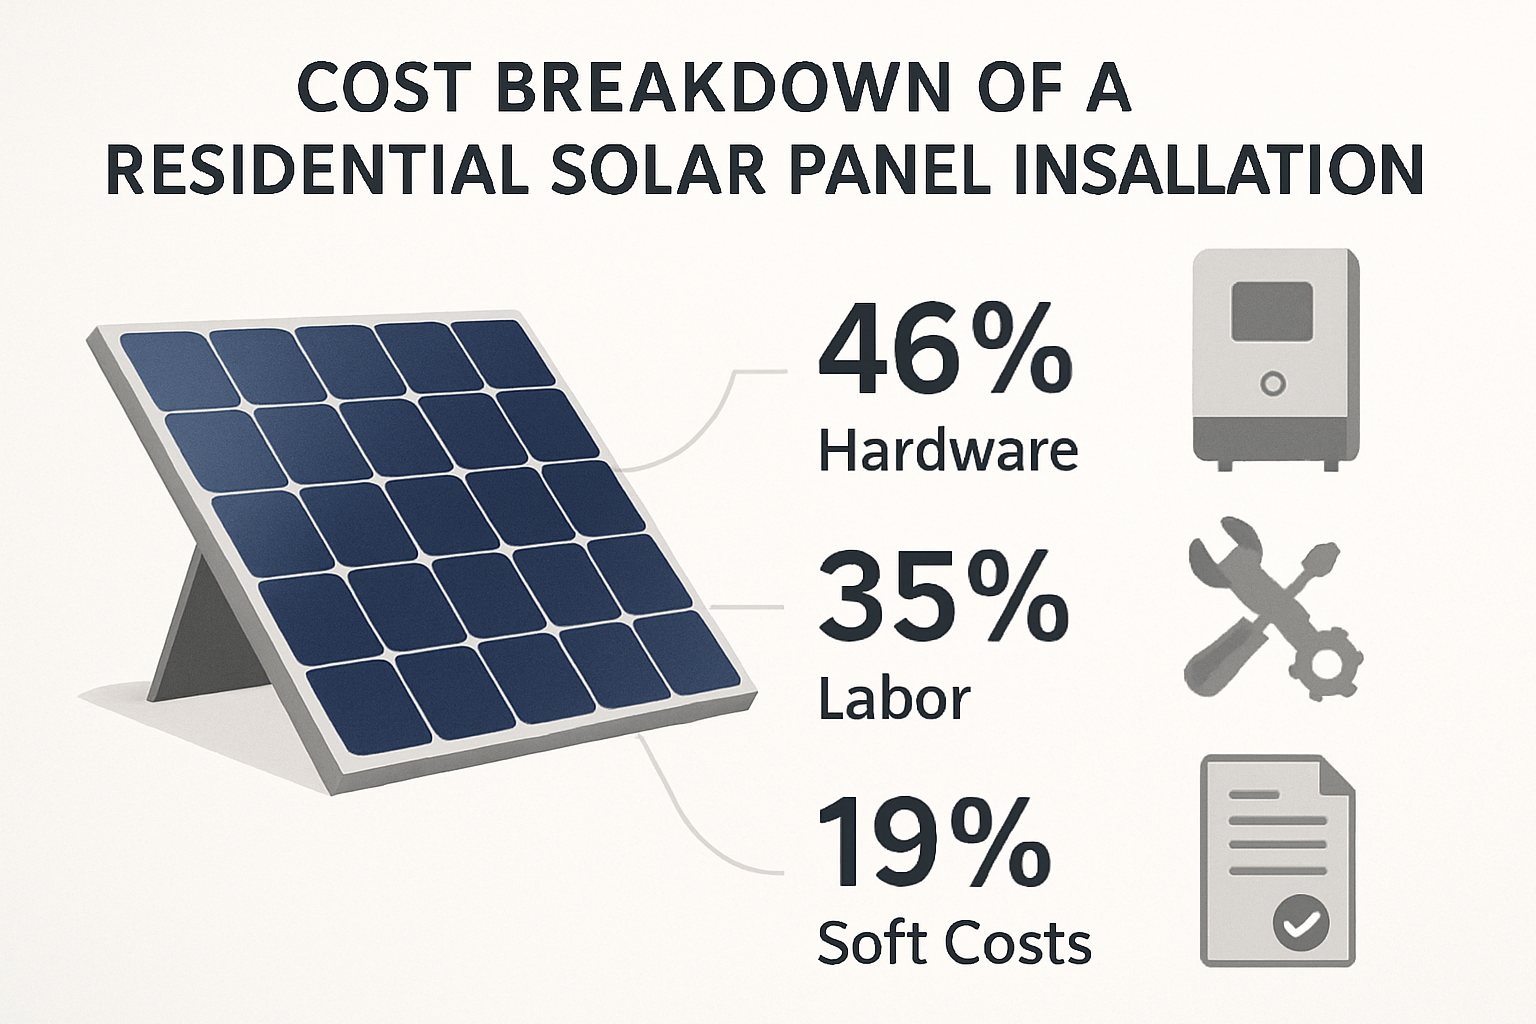
National Average Cost Breakdown
Here's a breakdown of what goes into the cost of a solar panel system. The panels themselves typically account for around 40-50% of the total cost. Inverters, which convert DC electricity from the panels to usable AC electricity, usually make up another 10-15%. Racking and mounting hardware add about 5-10%. Wiring, conduit, and other electrical components are around 5-10% as well.
Beyond the hardware, 'soft costs' include permitting fees (which vary widely by location), inspection costs, labor, and installer overhead. Soft costs can represent 20-30% of the total system price, explaining why costs differ so much between states. Getting multiple quotes helps understand these variations.
As of late 2024, the national average cost is around $3.00 per watt. So, a 5kW system (a common size for a typical home) would cost approximately $15,000 before incentives. A 7kW system would be around $21,000, and a 10kW system, suitable for larger homes or higher energy consumption, would run about $30,000. These are estimates, of course, and your actual cost will depend on your specific circumstances.
Installation complexity adds cost. Roof type, pitch, and shading all affect labor hours. Systems requiring electrical panel upgrades or roof repairs will be more expensive. A simpler installation on a south-facing, unshaded roof will be cheaper than a complicated one on a heavily shaded, east-facing roof.
State-by-State Price Variations
Solar panel installation costs vary significantly from state to state. States with strong renewable energy incentives, like California, Massachusetts, and New York, often have lower net costs even if the initial installation price is similar to the national average. These incentives can include state tax credits, rebates, and more favorable net metering policies.
States with limited incentives and higher labor costs, like Mississippi, Alabama, and Louisiana, tend to have higher installation costs. Local permitting requirements also play a big role. Some municipalities have streamlined the permitting process, while others have complex and time-consuming procedures that add to the overall cost.
Here's a snapshot of estimated average costs per watt in a few states (as of late 2024, projected to 2026): California - $2.70, Texas - $2.90, Florida - $3.10, New York - $2.80, Arizona - $2.60, North Carolina - $2.85, and Louisiana - $3.40. These numbers are based on data from EnergySage and Sunrun, and they are subject to change.
Climate influences costs. States with higher average sunlight hours (like Arizona and Nevada) may see a slightly lower cost per watt because the system will generate more electricity, potentially reducing the overall payback period. This isn’t a huge factor, but it’s something to consider. States experiencing rapid growth in solar adoption often see prices stabilize or even decrease due to increased competition among installers.
Solar Panel Installation Costs & Incentives - 2026 (Estimated)
| State | Avg. Cost per Watt ($) | Avg. 6kW System Cost ($) | State Incentives | Cost Factor (National Avg = 1.00) |
|---|---|---|---|---|
| California | 2.50 - 3.50 | 15,000 - 21,000 | Net Metering, Federal Tax Credit | 1.10 - 1.30 |
| Florida | 2.60 - 3.60 | 15,600 - 21,600 | Property Tax Exemption, Federal Tax Credit | 1.15 - 1.35 |
| Texas | 2.40 - 3.40 | 14,400 - 20,400 | Federal Tax Credit, some local rebates | 1.00 - 1.20 |
| New York | 2.70 - 3.70 | 16,200 - 22,200 | NY-Sun Incentive Program, Federal Tax Credit | 1.20 - 1.40 |
| Arizona | 2.30 - 3.30 | 13,800 - 19,800 | Federal Tax Credit, Net Metering | 0.95 - 1.15 |
| Massachusetts | 2.80 - 3.80 | 16,800 - 22,800 | State Tax Credit, Net Metering, Federal Tax Credit | 1.25 - 1.45 |
Illustrative comparison based on the article research brief. Verify current pricing, limits, and product details in the official docs before relying on it.
Impact of System Size & Panel Type
System size matters. Larger systems benefit from economies of scale. The cost of the inverter and racking doesn’t increase linearly with system size, so you’ll generally pay less per watt for a larger system. A 10kW system will almost always have a lower cost per watt than a 5kW system.
Panel type is another key consideration. Monocrystalline panels are the most efficient and generally the most expensive. Polycrystalline panels are less efficient but also less expensive. Thin-film panels are the least efficient and typically the cheapest, but they require more space to generate the same amount of power. As of late 2024, monocrystalline panels typically cost around $0.70 to $0.90 per watt, polycrystalline around $0.60 to $0.80, and thin-film around $0.50 to $0.70.
The choice of panel type depends on your specific needs and constraints. If you have limited roof space, monocrystalline panels are the best option. If you have plenty of space and are looking for the lowest upfront cost, polycrystalline or thin-film panels might be a better fit. Monocrystalline panels are recommended for most homeowners due to their higher efficiency and longer lifespan.
Beyond the panel material, panel wattage also affects price. Higher-wattage panels (400W+) are becoming increasingly common and can reduce the number of panels needed for a given system size, potentially lowering overall costs. However, these higher-wattage panels often come with a slightly higher price tag per panel.
Solar Panel Technology Comparison
- Monocrystalline Panels - These are known for their high efficiency (typically 20-22%) and sleek, uniform black appearance. They are generally the most expensive option upfront.
- Polycrystalline Panels - A more affordable option than monocrystalline, polycrystalline panels have a slightly lower efficiency (around 15-17%) and a blue, speckled appearance.
- Thin-Film Panels - These are the least expensive to manufacture, but also the least efficient (typically 10-13%). They are flexible and lightweight, making them suitable for curved surfaces.
- Cost per Watt (2026 Estimate) - Monocrystalline: $2.60 - $3.00, Polycrystalline: $2.20 - $2.60, Thin-Film: $1.50 - $2.00 (These are estimates and vary by manufacturer and installer).
- Typical Lifespan - Most solar panels, regardless of type, come with a 25-30 year performance warranty. Monocrystalline and polycrystalline panels generally maintain performance slightly better over time.
- Efficiency Considerations - Higher efficiency panels (monocrystalline) require less roof space to generate the same amount of power, which is beneficial for homes with limited roof area.
- Best Use Cases - Monocrystalline: Homes with limited roof space, those prioritizing maximum power output. Polycrystalline: Cost-conscious homeowners with ample roof space. Thin-Film: Unique applications like curved roofs, portable power solutions.
Federal Tax Credits & Local Incentives
The federal solar tax credit is the most significant incentive available to homeowners. It allows you to deduct 30% of the cost of your solar panel system from your federal taxes. This credit applies to both purchased and leased systems, but there are some limitations. The system must be new or used for the first time, and it must be installed at your primary or secondary residence. This 30% credit is scheduled to continue through 2032.
Eligibility requirements are fairly straightforward, but consulting with a tax professional is recommended to ensure you qualify. You’ll need to file Form 5695 with your tax return to claim the credit. The credit is non-refundable, meaning you can’t get any of it back as a refund if it exceeds your tax liability.
Beyond the federal tax credit, many states and local municipalities offer additional incentives. These can include state tax credits, rebates, property tax exemptions, and net metering policies. Net metering allows you to sell excess electricity generated by your solar panels back to the grid, offsetting your electricity bill.
Finding these incentives can be tricky. The Database of State Incentives for Renewables & Efficiency (DSIRE) is an excellent resource. You can search by state to find all the incentives available in your area. Your local utility company may also offer rebates or incentives. Researching these options can significantly reduce your overall cost.
Calculating Your Solar ROI
Calculating your return on investment (ROI) helps determine if solar panels are a good investment for you. Estimate your annual electricity consumption and your current electricity rate. Then, estimate how much electricity your solar panel system will generate each year. This depends on the system size, panel efficiency, and your location’s sunlight hours.
Calculate your annual electricity bill savings by multiplying the amount of electricity generated by your system by your electricity rate. Factor in net metering credits, if applicable. Also, account for the federal tax credit and any state or local incentives. These incentives reduce your upfront cost, which improves your ROI.
The payback period is the number of years it takes for your cumulative savings to equal your initial investment. A shorter payback period is more desirable. The payback period will vary depending on your location, energy consumption, system cost, and available incentives. Payback periods typically range from 5 to 15 years.
Consider the lifespan of the system when calculating ROI. Most solar panels come with a 25-year performance warranty, guaranteeing they’ll still produce at least 80% of their original output after 25 years. Factor in potential maintenance costs (typically minimal) and the long-term value of your investment. A well-maintained system can provide decades of savings.
Financing Options: Loans & Leases
Solar loans are the most common way to finance a solar panel system. These are typically unsecured personal loans or home equity loans. Interest rates vary depending on your credit score and the loan term. Secured loans, backed by your home equity, usually offer lower rates.
Power purchase agreements (PPAs) and solar leases are other options. With a PPA, you agree to purchase electricity from a third-party owner of the solar panels at a fixed rate. With a solar lease, you rent the panels from a third party. Both PPAs and leases require little to no upfront investment, but you don’t own the system.
Each financing option has pros and cons. Loans allow you to own the system and benefit from the tax credit and long-term savings, but you’re responsible for maintenance and repairs. PPAs and leases offer convenience and lower upfront costs, but you don’t build equity and may pay more over the long term.
Solar loans generally offer the best long-term value for most homeowners. However, PPAs and leases can be a good option if you don’t have the upfront capital or don’t want the responsibility of ownership. Carefully compare the terms and conditions of each option before making a decision.
Solar Financing Options: A Comparison (Estimated for 2026)
| Financing Method | Upfront Cost | Ownership | Maintenance Responsibility | Long-Term Cost |
|---|---|---|---|---|
| Solar Loan | Typically requires a down payment, potentially 10-20% of total system cost | Homeowner | Homeowner | Potentially lowest overall cost, dependent on interest rate and loan terms |
| Power Purchase Agreement (PPA) | Generally $0 down | Third-Party Owner | Third-Party Owner | Cost of electricity may be lower than utility rates, but homeowner doesn't benefit from system appreciation or incentives beyond rate savings |
| Solar Lease | Generally $0 down | Third-Party Owner | Third-Party Owner (typically) | Fixed monthly payments; cost of electricity may be predictable, but homeowner doesn't benefit from system appreciation or incentives |
| Cash Purchase | Full system cost paid upfront | Homeowner | Homeowner | Highest upfront cost, but potential for significant long-term savings and maximizing incentives |
| Property Assessed Clean Energy (PACE) | Financing secured by a lien on the property | Homeowner | Homeowner | Repaid through property taxes; can increase property tax bill and may have limitations on loan transfer |
Illustrative comparison based on the article research brief. Verify current pricing, limits, and product details in the official docs before relying on it.
No comments yet. Be the first to share your thoughts!